{logistic management web application}
{Brief introduction to background}
A local small-scaled logistic company is about to expand its scale to accommodate a recently acquired order, they need a order and stock management system, preferably web based for better accessibility.
{What is the challenge?}
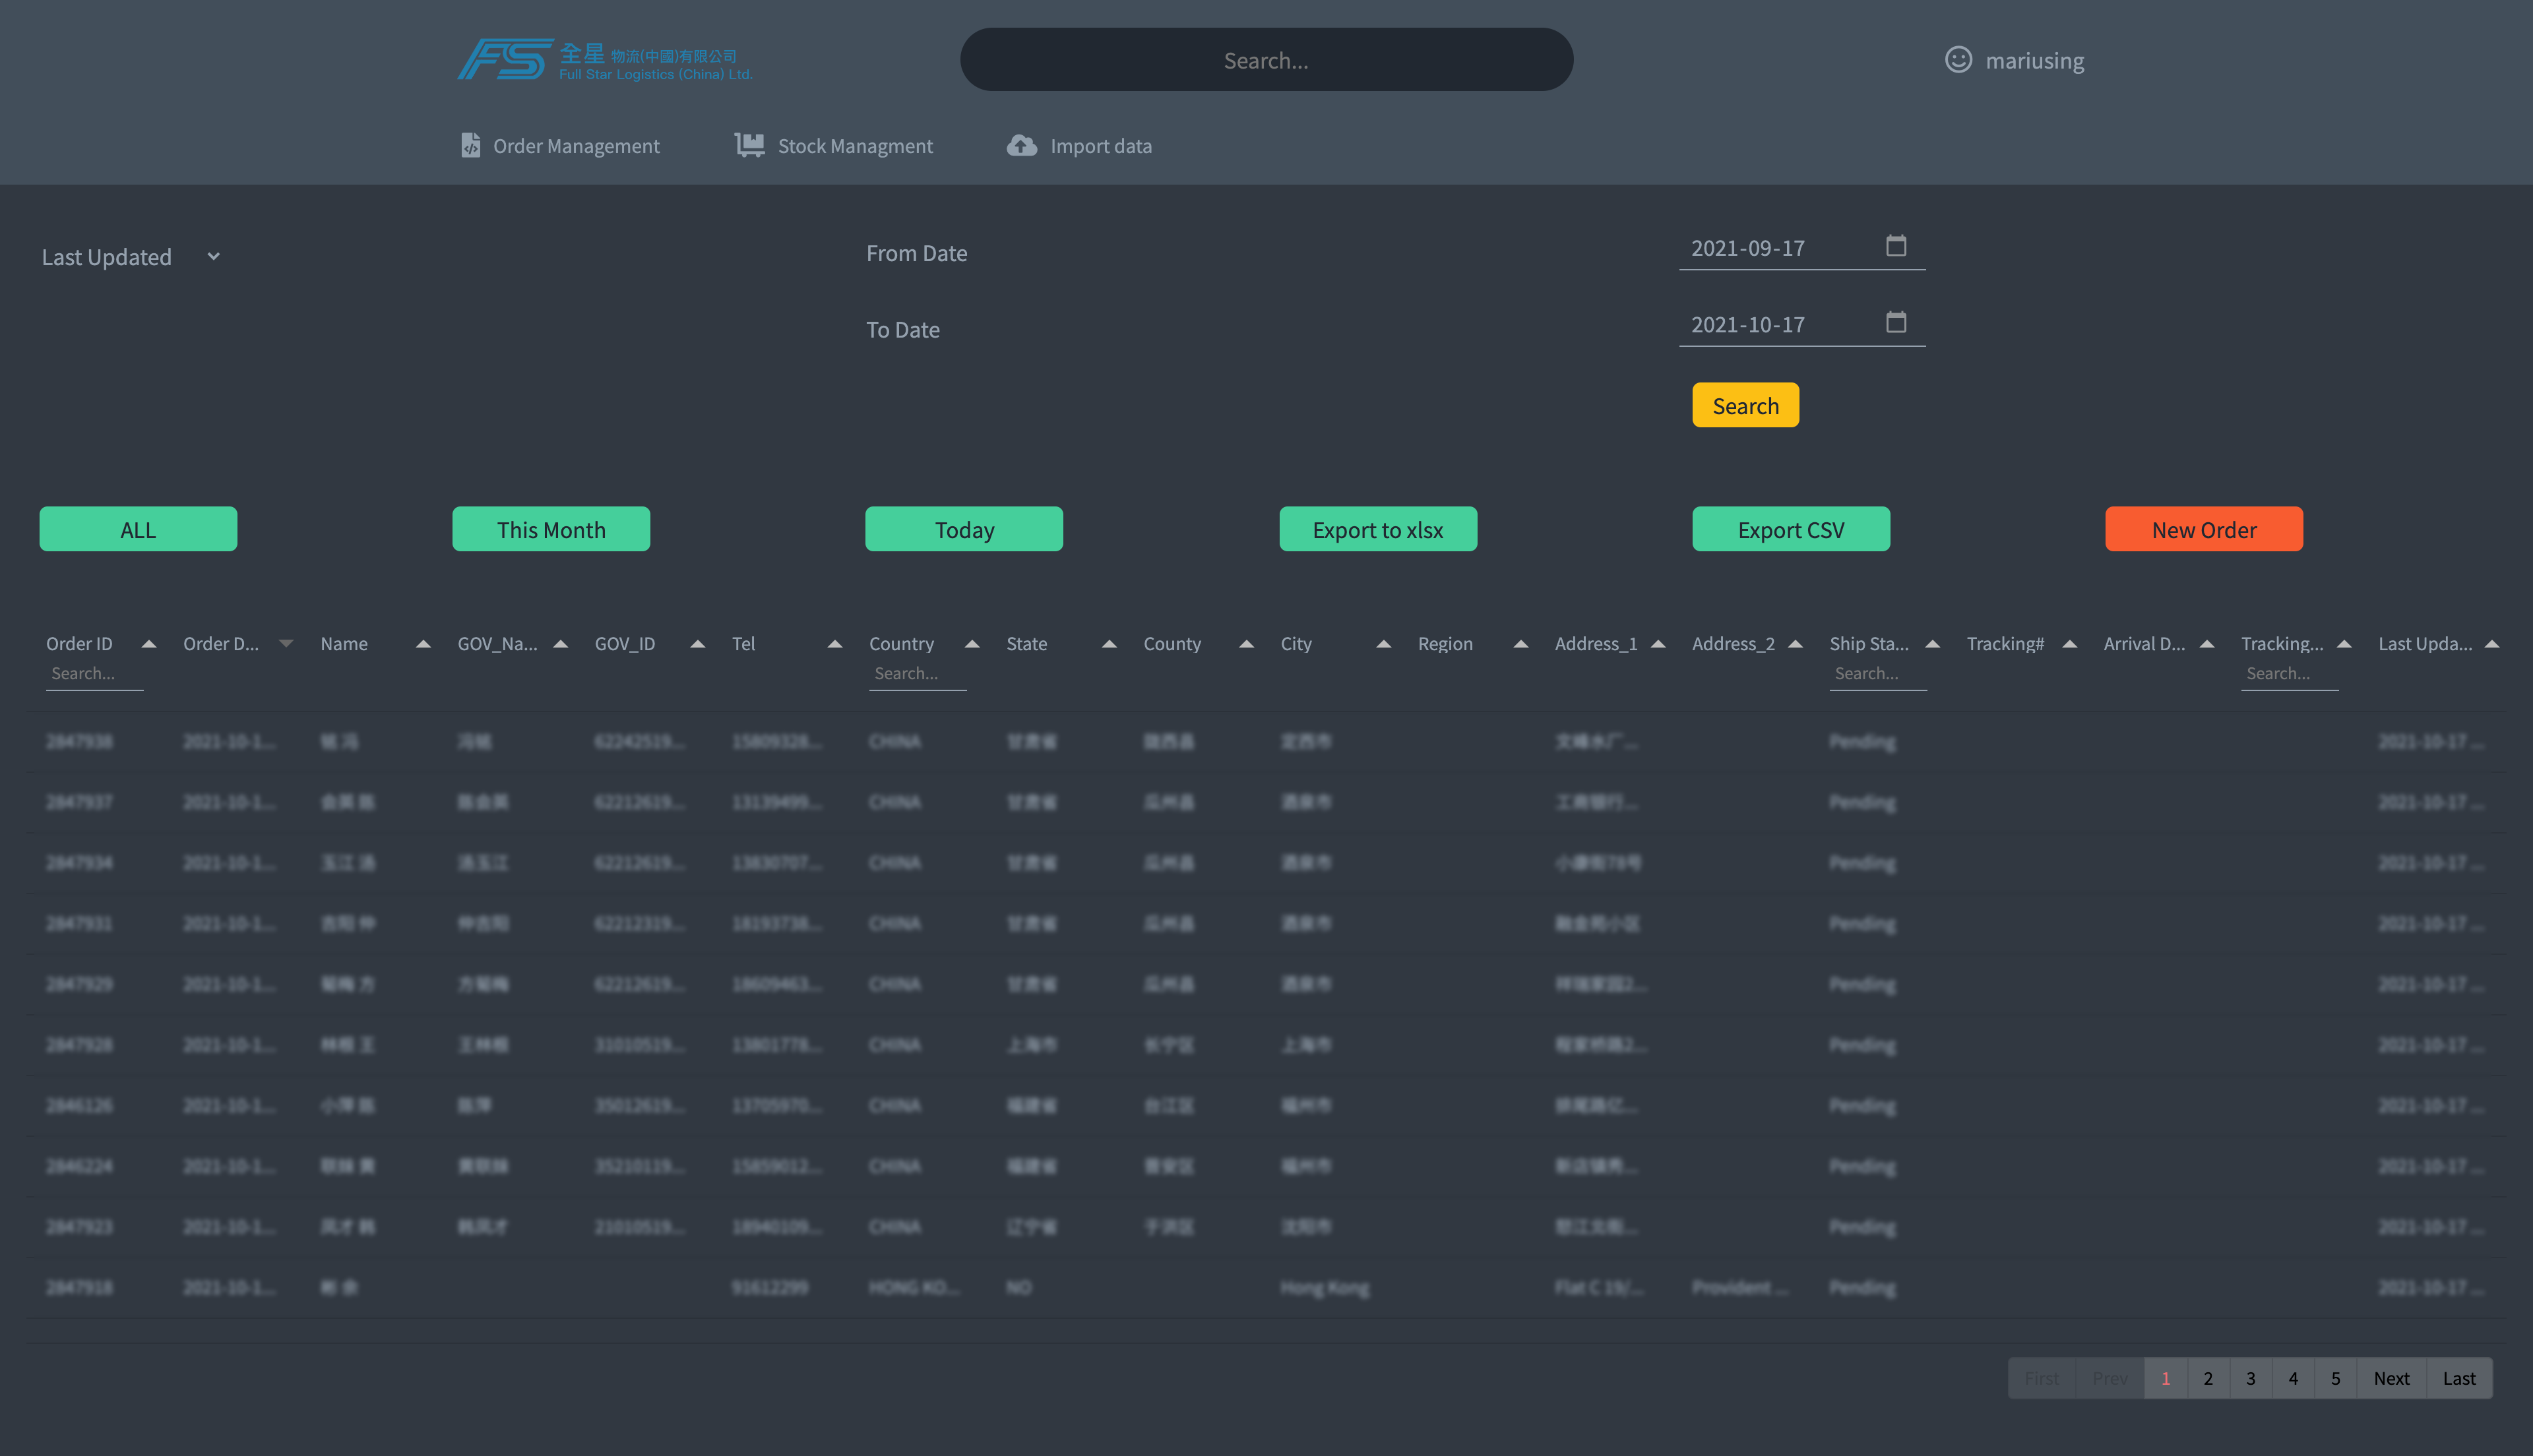
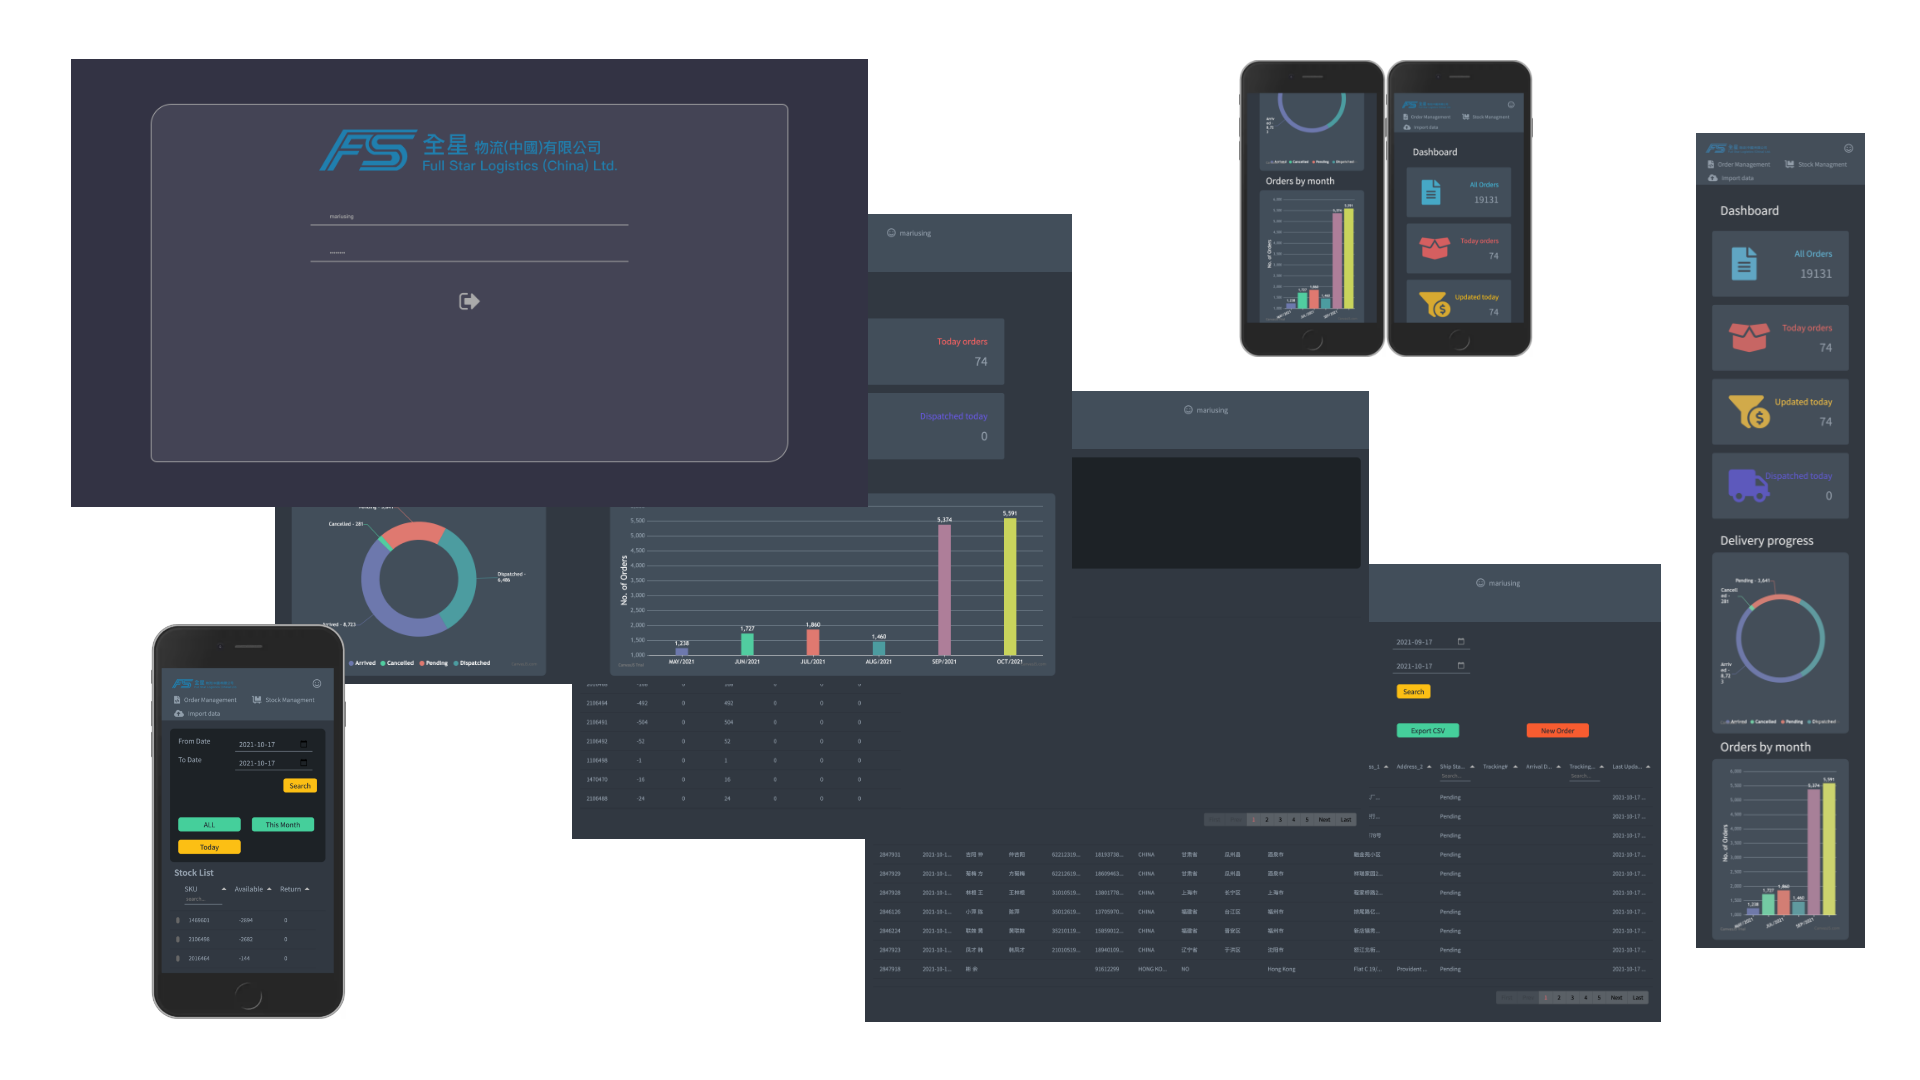
Currently this company is using spreadsheet to organise the order they have taken and manage to deliver up to around 100 orders a day. They need a more powerful system to manage the increasing orders recently acquired. In the initial meeting, they raised that they would require a easy to read and manage data structure to organise their orders as well a visual representation of their performance.
{Role}
Full stack from scratch to finish, UX designer, user research, prototype, usability test and final production
{Duration}
Aug 2020 - Dec 2020
User pain point
Slow on opening the files - A large spreadsheet files is resource hunting and thus make it slow on opening, especially on a lower-spec computer.
Single user write only - At any same time, it would allow only one single user to modify and save the files, making it less efficient and data error may occur from time to time.
Lack of visual data on performance - Spreadsheet do not have visual cues on hows the performance especially on comparing to the data month by month.
No remote access - Spreadsheet requires on the site saving and the team lead could not access those data remotely.
Insights
This is a design before I started my course on a proper UX/UI design, I did not follow a proper design system and did not keep the prototype I sent to my client. I start it right from development and showcase to my client in the mid-way.
Feedback
After finishing mid-point on development, I conducted a research on usability studies with my clients and their users. I received quite a lot of feedbacks from design perspective as well as functionality perspective. I note all the feedbacks on my notebook and re-iterate on my design there after. Feedback from the users are very important as they would be ultimately the main users. I iterated my design based on the feedback and did another round of usability studies with them.
Visual presentation of data is very useful and powerful in data management, with the help of the automated inventory system and the logistic management system, my client is now able to process more than 5 times of the original capacity. The dashboard is especially useful when the management of the company want to review on its strategy on business.